Once we
activated Apache we can install Eclipse and configure PHP for local debug
Installing Eclipse
Eclipse is a most powerful IDE ever made by mankind… As long as you know your way around… Its power is coming from variety of toolkits, plugins, extensions and so on – making it extremely complicated to navigate and find your way if you lost… Lets’ install only basic configuration suitable to develop & debug Java and PHP applications
Adding PHP support
For PHP support, install “PDT” – “PHP Development Toolkit”. Go to Help->”Install New Software”
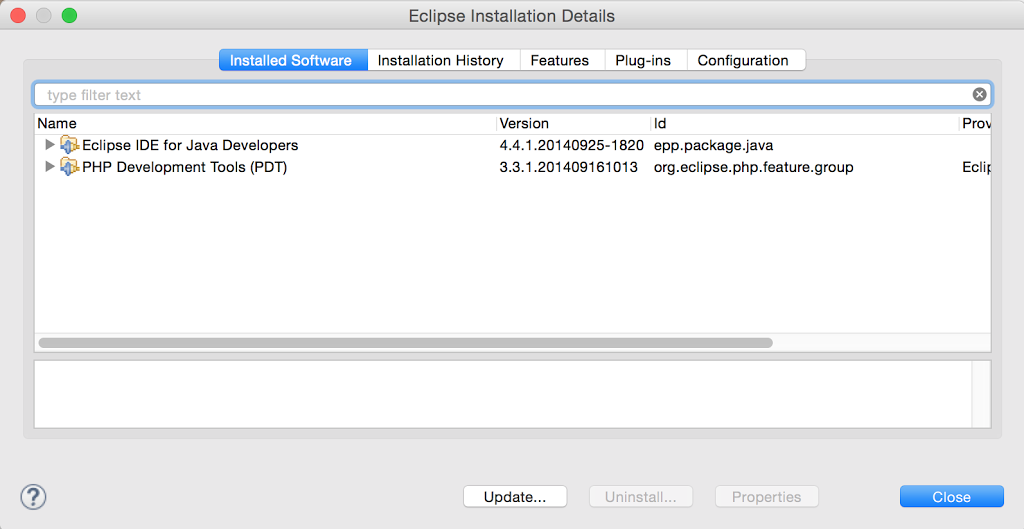
To check if your Eclipse already have PDT installed, go to Help->Installation Details. It list all installed components: in our example – Java IDE ( installed with base Eclipse installation) and PHP add-on
Configure PHP debugger
Install Zend Debugger
Zend Debugger is a free part of otherwise commercial product (‘Studio”) that compete with Eclipse. It maybe one of the reasons why installation of debugger is not streamlined. Also, checking some legacy websites, you may realise that instructions WHERE to download are may differ from time to time.. At the time of writing , most updated information on Zend Debugger installation is available at
http://files.zend.com/help/Zend-Studio/zend-studio.htm#installing_the_zend_debugger.htm Notes on architecture ( to understand better configuration details): Zend Debugger is PHP extension library to be stored in same place as other PHP extensions on the SERVER host – the one where PHP script is actually executed ( as we setting up configuration for local debug – it will be the same one, but all techniques are similar for remote debug as well). PHP configuration has to be updated with location of the extension library and list of permitted clients to connect ( you don’t want to allow everyone to see website intestinals, aren’t you?) . When you start debug session under PDT, it will connect to Zend Debugger and do all magic of debugging..
Debugger installation and setup – step by step
0.) “Who moved my cheese”… Apparently freshly installed/upgraded MacOS host does not have php.ini 😉 It has to be located in /etc/php.ini, but instead i found only /etc/php.ini.default. So , first item of business is to
sudo cp /private/etc/php.ini.default /private/etc/php.ini
and restart apache.
in you website root directory (/Library/WebServer/Documents if you not using virtual hosts) create file info.php with single line
fire your browser to get this file and check results.
First we check “Loaded Configuration File” – it has to be /etc/php.ini ( if empty, it mean that you missed previous step).
Second search for “extension_dir” and note its value – it is where we’ll copy Zend Debugger. On my host its value is “/usr/lib/php/extensions/no-debug-non-zts-20121212″
Same result you can get by running in command line
php -i|grep extension_dir
1.) download “Zend Studio Web Debugger” from
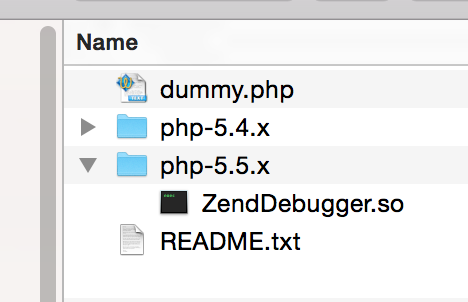
http://www.zend.com/en/products/studio/downloads#Mac%20OS and open archive. It includes
ZendDebugger (depends on php version) and dummy file used for testing. Check your PHP version with “php -v” ( i have 5.514) and copy appropriate ZendDebugger.so file to extension directory discovered above. In my case it is
sudo cp ~/Downloads/ZendDebugger-darwin10.7-x86_64/php-5.5.x/ZendDebugger.so /usr/lib/php/extensions/no-debug-non-zts-20121212
copy dummy.php file into your web server root directory
sudo cp ~/Downloads/ZendDebugger-darwin10.7-x86_64/dummy.php /Library/WebServer/Documents/
2.) Modify PHP configuration settings (/private/etc/php.ini) to activate debugger extension – add following 2 lines to the end:
zend_extension = /usr/lib/php/extensions/no-debug-non-zts-20121212/ZendDebugger.sozend_debugger.allow_hosts = 127.0.0.1
don’t forget to restart apache to activate new configuration
3.) Now is a good time to test if our configuration works: first open in http://localhost/info.php – you will see a new “Zend Debugger” section.
Now we can go back to Eclipse and check debugger here as well..
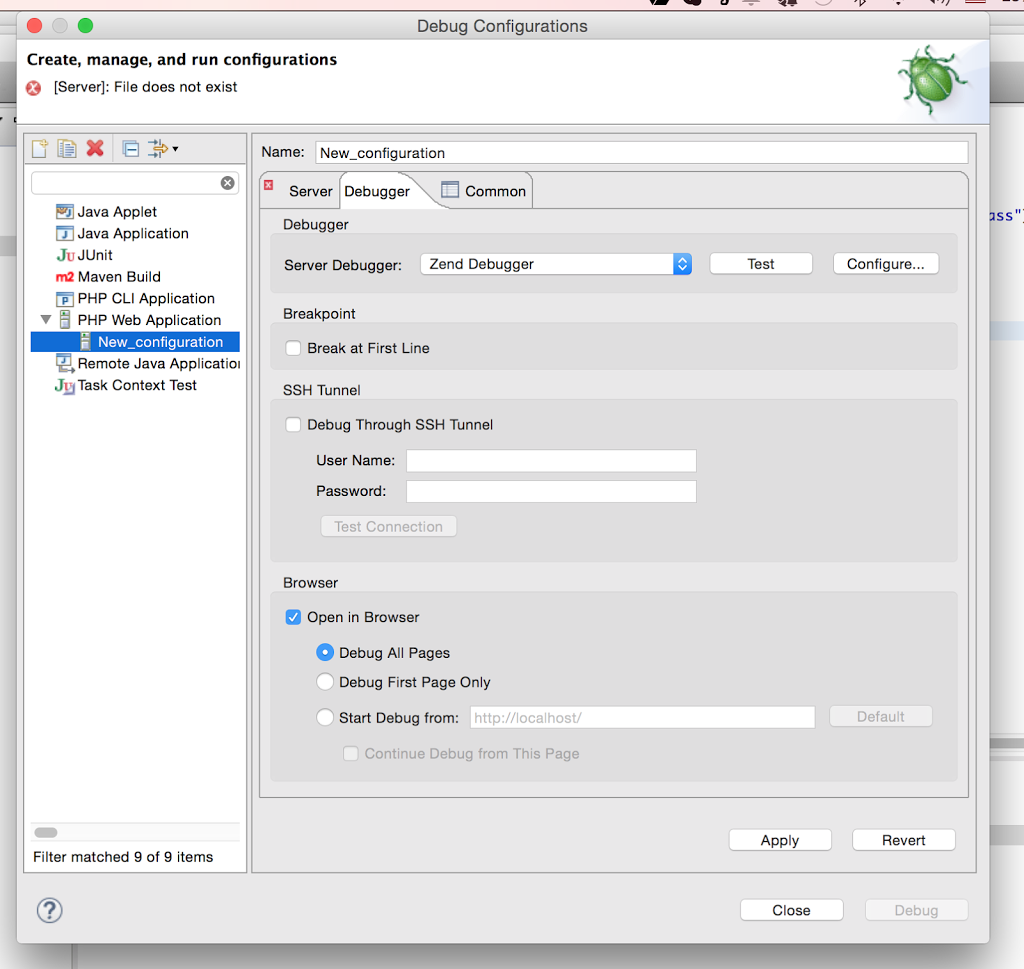
In your project , open “Debug as -> Debugger Configuration” and go to Debugger tab:
Click on “text” – if configuration right, you’ll see “Successful” message..
All set – happy debugging!
P.S.Some useful documentation also can be found at